WebPad
What’s inside
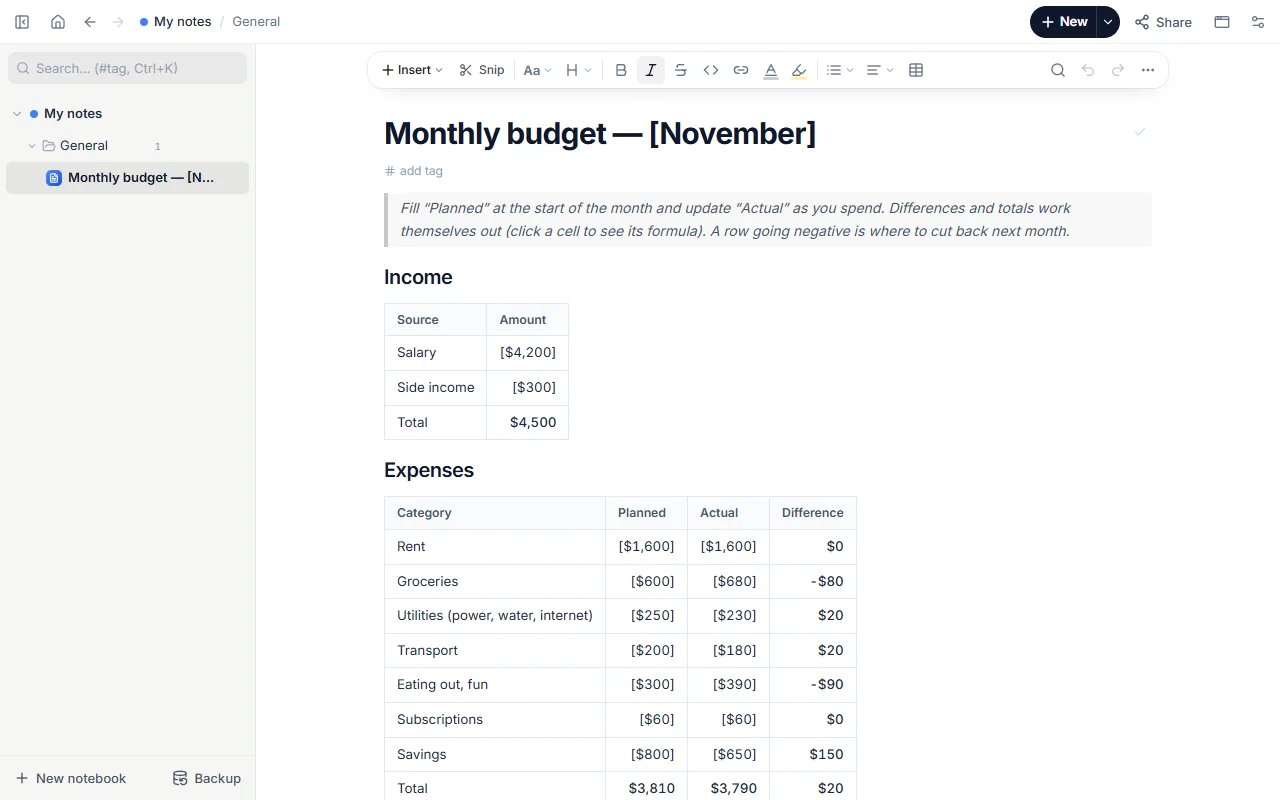
- Income table with a total that adds itself up
- Expenses: planned, actual, difference (formulas) and a total row
- A chart of planned spending
- Decisions for this month
How to use it
- Open the template; it comes with an example month.
- At the start of the month enter income and a planned amount per category.
- Update “Actual” as you spend; differences and totals update themselves.
- Look at the categories going negative and add a decision for next month.
- At month end copy the page, rename the month and start again.
Tips that help
- Put savings first, like a bill (“pay yourself first”); money left over at month end rarely appears.
- Divide yearly payments (insurance, taxes, subscriptions) by 12 and budget them monthly, so the month they’re due doesn’t break the plan.
- Keep 6–8 categories: more is hard to track, fewer hides where money goes.
Questions
How do the calculations work?
Cells take spreadsheet formulas: the difference cell holds =B2-C2, the total =SUM(B2:B8). Click a cell to see and edit its formula. “Add a total row” in the table menu sums every column with numbers.
Does the chart update with the numbers?
The chart keeps its own data; use “Make a chart” in the table menu to make a fresh one from the current table.
Is it free? Do I need an account?
Free, and no account. “Start with this template” opens it in the WebPad Studio web version, ready to write in.
Where is what I write saved?
In your browser’s own storage, on your device only. If you like, back it up to your own Google Drive and sync it across devices; there is no server of ours.
Can I download it as PDF or Word?
Yes. Text pages download as PDF and Word, drawings save as images, and you can share a page with a link.