WebPad
What’s going on
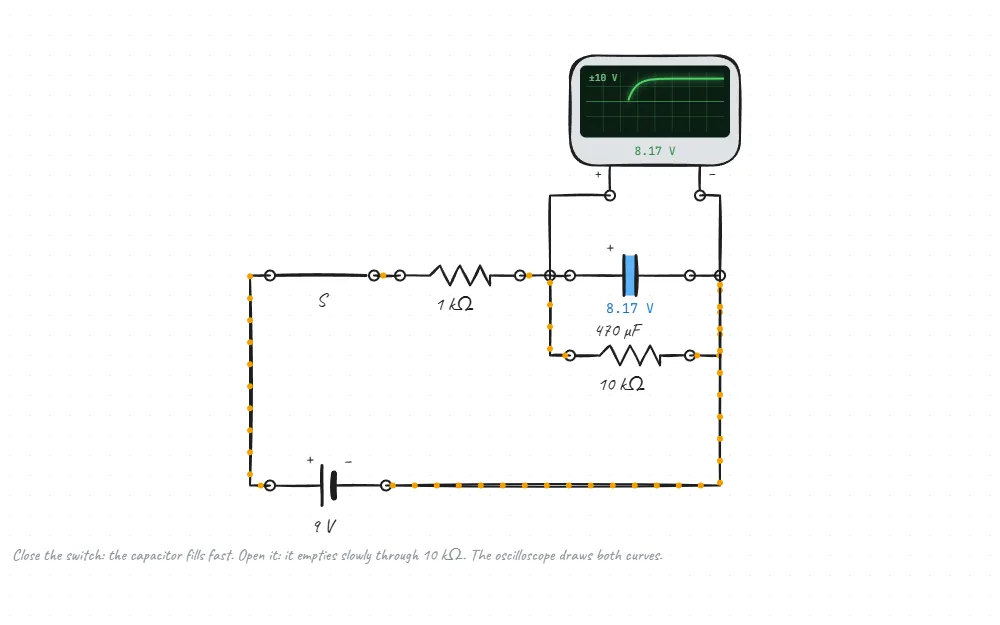
An oscilloscope draws how a voltage changes over time. Here it is connected across the capacitor, so the line on its screen is the capacitor’s voltage.
With the switch closed, the capacitor charges through the 1 kΩ resistor. When it is opened, the current can only leave through the 10 kΩ resistor. Ten times the resistance means discharging takes roughly ten times as long.
Both curves are exponential: they change fast at first, then slow down. After one time constant (τ = RC) a charging capacitor has reached about 63% of its final voltage, and a discharging one has dropped to about 37%.
The formula
τ = R × C
- τ: time constant, s
- R: resistance on the charging or discharging path, Ω
- C: capacitance, F (470 µF = 0.00047 F)
Things to try
- Close the switch and watch the oscilloscope. The line rises quickly and levels off: the capacitor is charged.
- Open the switch. The line falls much more slowly: it is discharging through 10 kΩ.
- Change the discharge resistor from 10 kΩ to 2 kΩ. The discharge curve gets steeper; the capacitor empties faster.
- Open and close the switch quickly, again and again. The capacitor never has time to fill or empty, and the screen shows a sawtooth-like line.
Questions and answers
What is the discharge time constant with 10 kΩ and 470 µF?
τ = 10 000 × 0.00047 = 4.7 s.
How charged is a capacitor after one time constant?
About 63% of its final voltage. After about five time constants it counts as fully charged.
How is an oscilloscope different from a voltmeter?
A voltmeter shows the voltage now as a number. An oscilloscope draws how it changes over time, so quick changes show up too.
For teachers
- Have students mark the moment τ on screen and find the 63% rule by measuring.
- Do the capacitor charging experiment first, then this one: the same event seen two ways.